ModelFLOWs-cardiac, a branch of the ModelFLOWs-app which contains an open source Software for pattern identification, classification and prediction of cardiovascular diseases (CVDs) using modal decomposition and deep learning architectures, together with CFD databases and codes for obtention of cardiac flow simulations.
Main projects funding this research:
2022-2024. DigitHEART (New tools and models based on CFD and non-invasive imaging to predict heart disease progression and response to treatment). Plan de Recuperación, Transformación y Resiliencia–Ministerio de Ciencia e Innovación, Spain, TED2021-129774B-C21.
2022-2025. CardioAging (Mecanometabolismos de la insuficiencia cardíaca asociada a la edad). Líneas Estratégicas–Ministerio de Ciencia e Innovación, Spain, PLEC2022-009235.
News related to the projects:
Desarrollan un sistema para reconocer patologías cardíacas basado en IA
Content:
1- Medical Data
2- CFD Data
This data-driven application consists of two modules: Medical data and CFD data. The first one contains three blocks: Pattern detection, Classification and Prediction. The latter one contains two blocks: Codes and simulations and Pattern detection.
Medical data
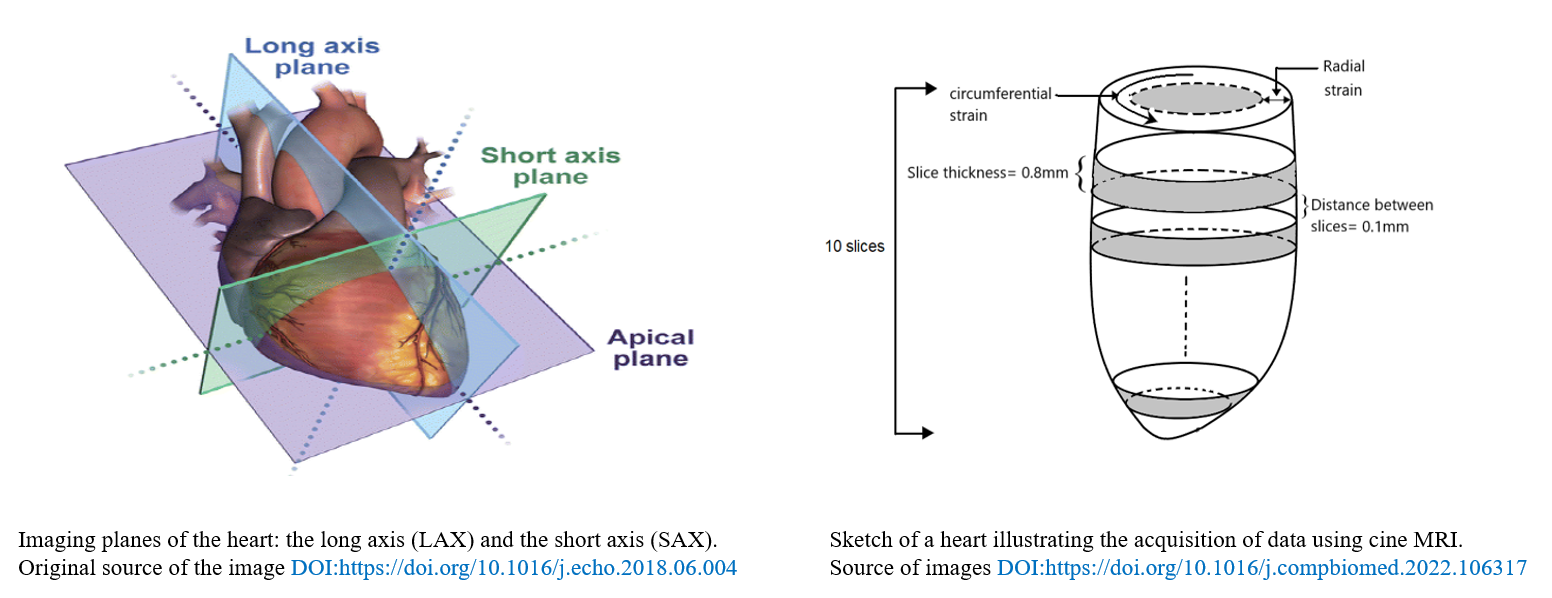
The medical imaging datasets used for this first application are echocardiography video loops and magnetic resonance imaging (MRI):
- The echocardiography videos are taken with respect to two views: long axis and shorts axis views (LAX and SAX respectively). The images are taken from mice with different cardiac conditions including healthy, diabetic cardiomyopathy, myocardial infarction, obesity, TAC hypertrophy). Each video consists of ~120 frames (snapshots).
- The MRI dataset consists of 10 MRI sequences, representing 10 different slices of the heart. In particular, 20 images (snapshots) of 128 × 128 × 1 resolution were acquired for each slice, resulting a total number of 200 snapshot per dataset.
Pattern detection
HODMD
Medical imaging field is being profoundly affected by the technological revolution brought forward by increasingly sophisticated electronic devices and the continuous growth of computing power. Therefore, medical imaging has become a data intensive field: optimized tools grounded in the data science discipline are necessary to reap the full potential of the wealth of data available. starting from a certain point, approaches based on matrix decomposition and data-driven methods began to gain recognition in medical analysis field. In this research, we focused on the fluid dynamic tool, the higher order dynamic mode decomposition (HODMD). In the following the HODMD was applied to the analysis of echocardiography images as a feature detection technique, with the aim of identifying main patterns related to different cardiac conditions.
Analysis and findings
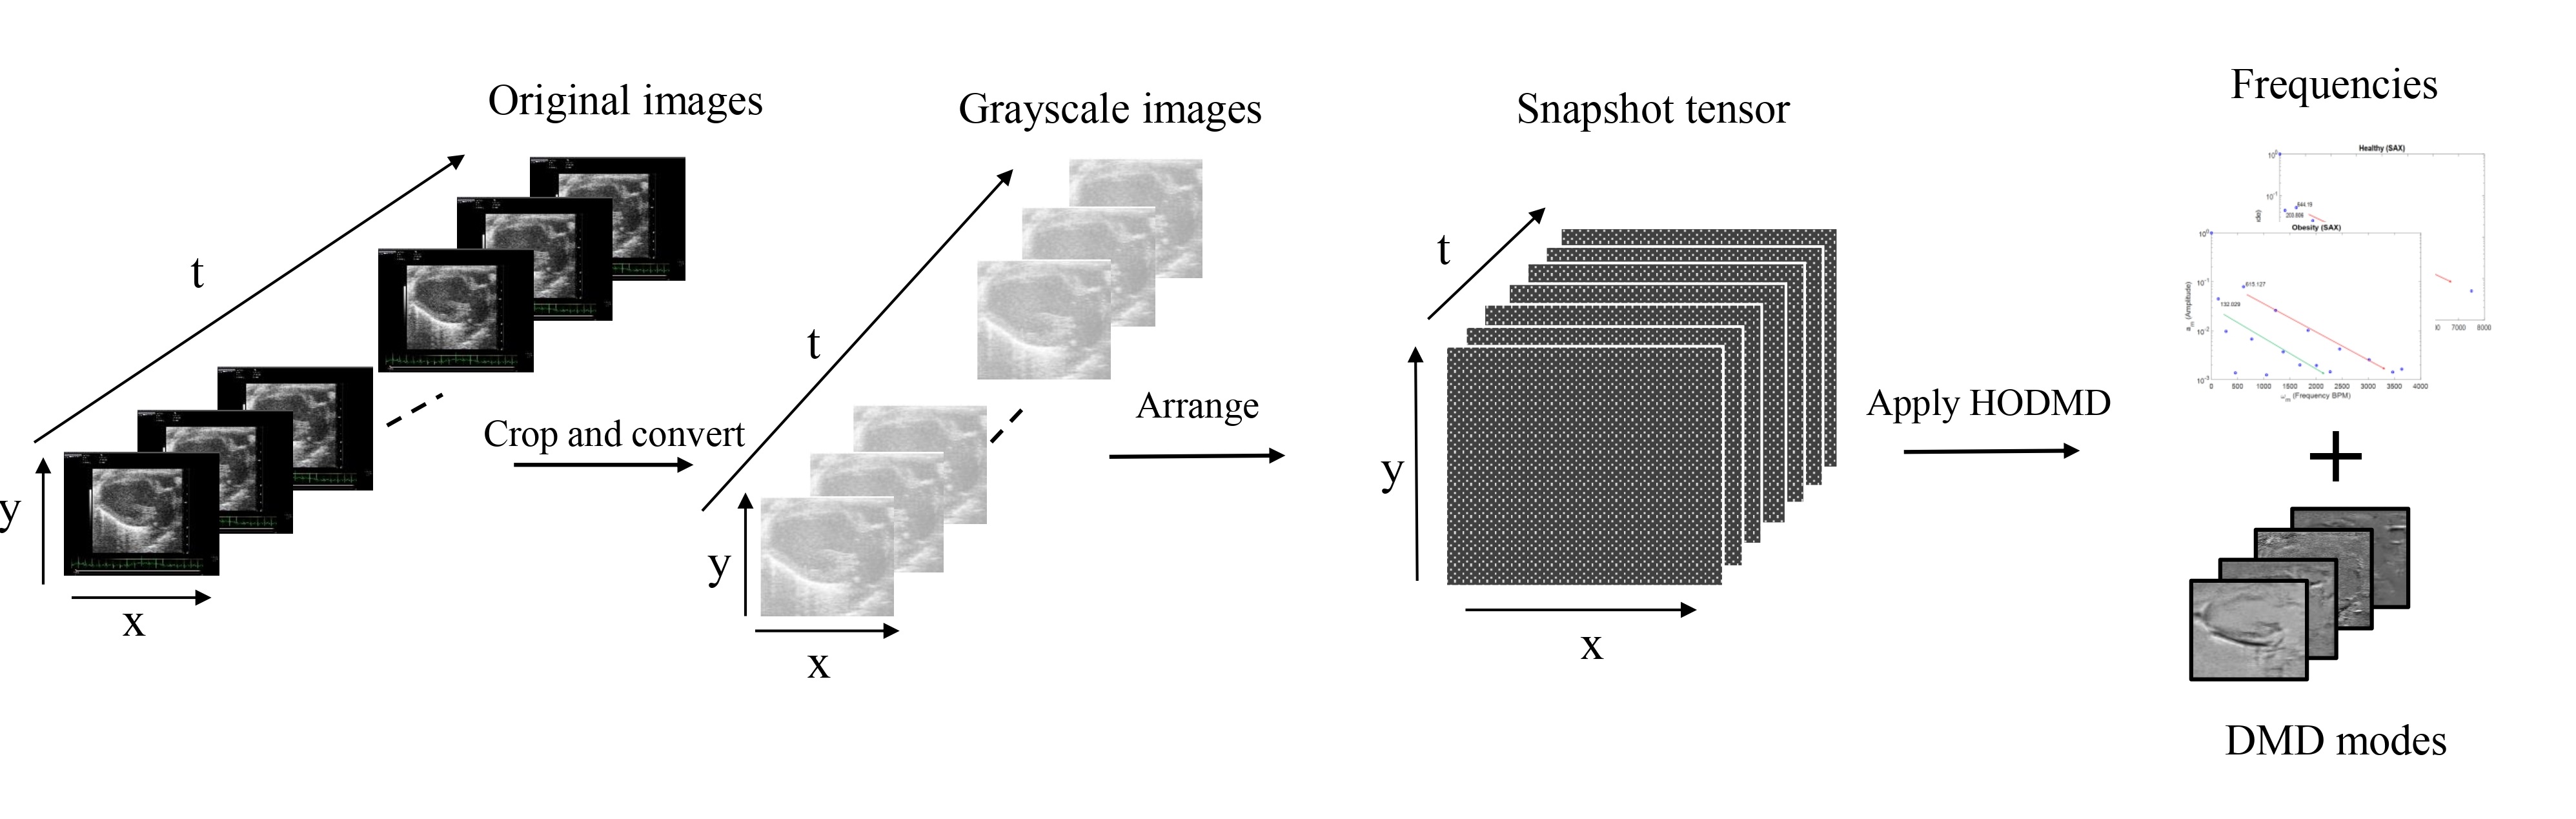
The main process for the higher order dynamic mode decomposition (HODMD) analysis pipeline is summarized in the schematic diagram. The first step is data preparation: each frame (snapshot) extracted from the video loop is cropped (removing the parts with the medical information), then arranged in a tensor, which is then used as the HODMD input. In the following steps, HODMD decomposes the data into a set of DMD modes, each associated with its own frequency, growth rate and amplitude.
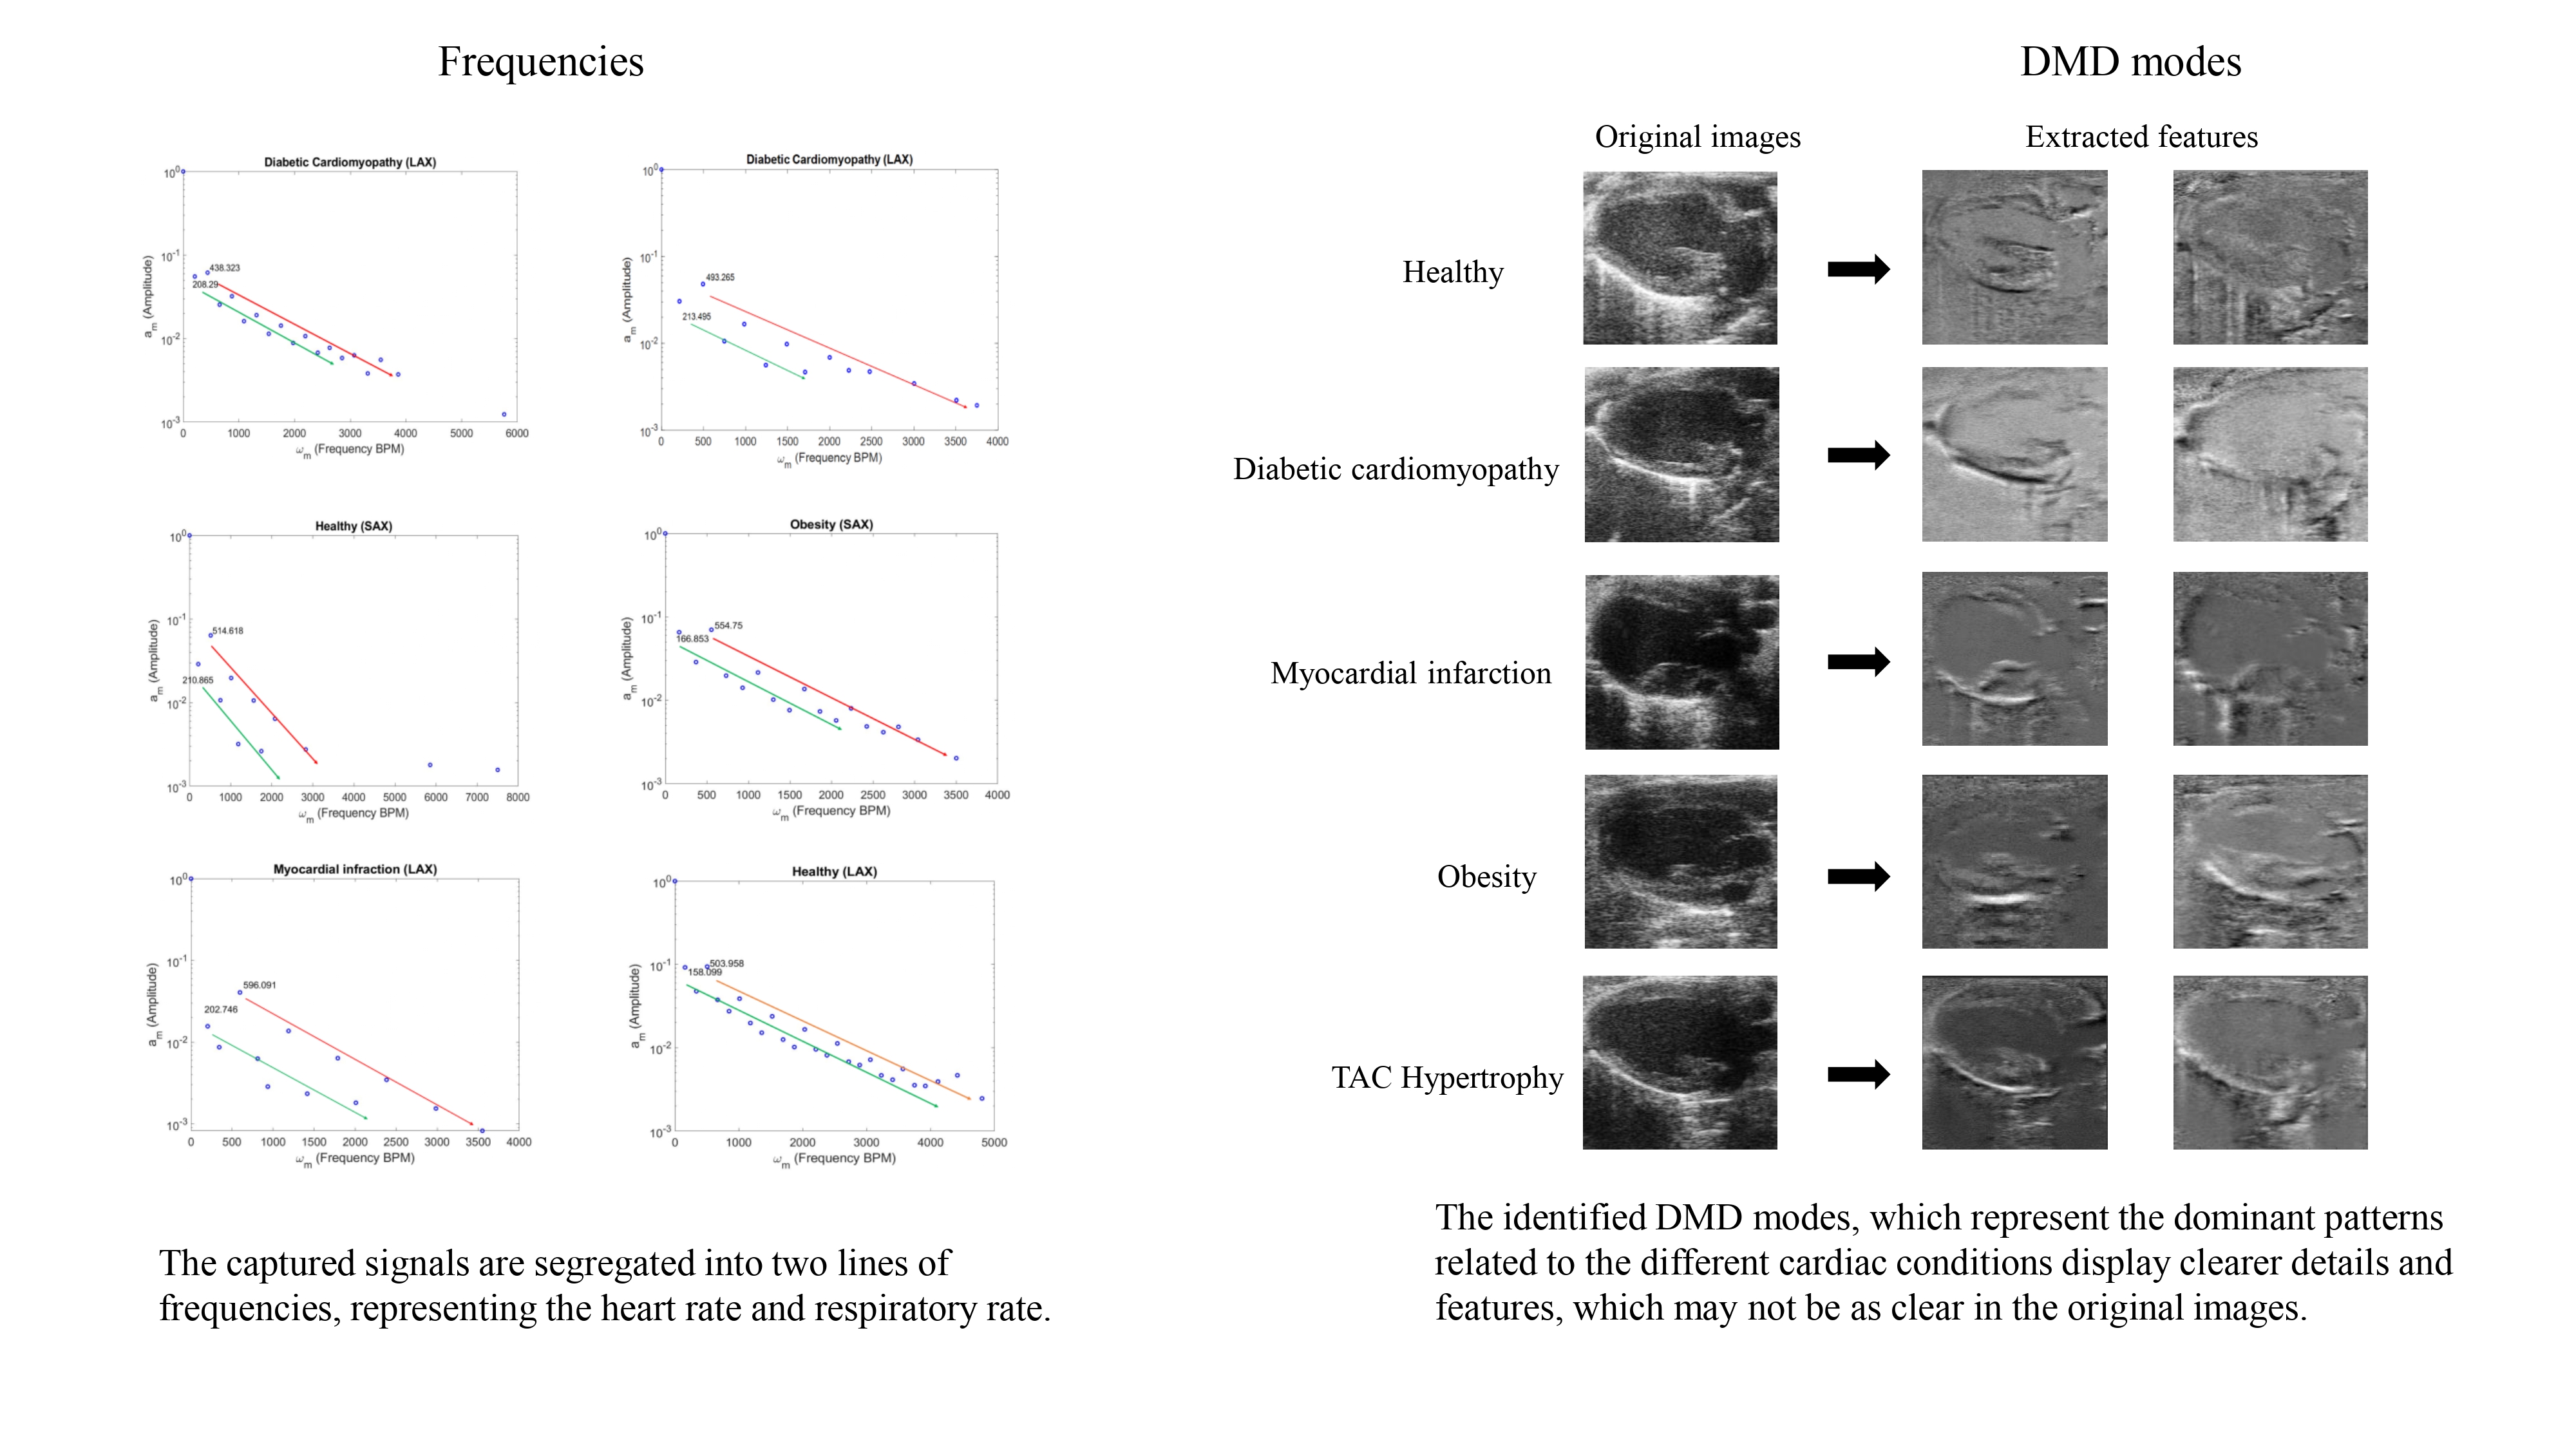
The analysis of the echocardiography datasets using the HODMD algorithm resulted in two main outcomes: (i) identify and segregate two different signals. The signals, which are regular and periodic, represent the heart rate and respiratory rate. (ii) Successfully identifying and extracting sets of DMD modes representing the dominant features and patterns related to the different cardiac conditions. These DMD modes display the shape of the heart in its healthy conditions, as well as its shape when afflicted by different cardiac diseases.
These results have already been published in:
You can also see the explanation of this paper in the following video:
Cardiac disease classification
Hybrid ROM combining HODMD and CNNs
In this application the HODMD algorithm is combined with convolutional neural networks (CNNs) to improve the classification accuracy of five different cardiac conditions. In order to demonstrate this application, two testcases are performed: first, the model (CNN) is trained using a database consists of the original echocardiography images only (testcase 01). Second, the database with the original images is augmented using the DMD modes obtained from the HODMD analysis.
The following sketch summarizes the main steps of the application carried in this work, which can be sectioned into two stages:
- Feature extraction stage using the HODMD algorithm (as illustrated in the previous application).
- Disease classification using CNNs.
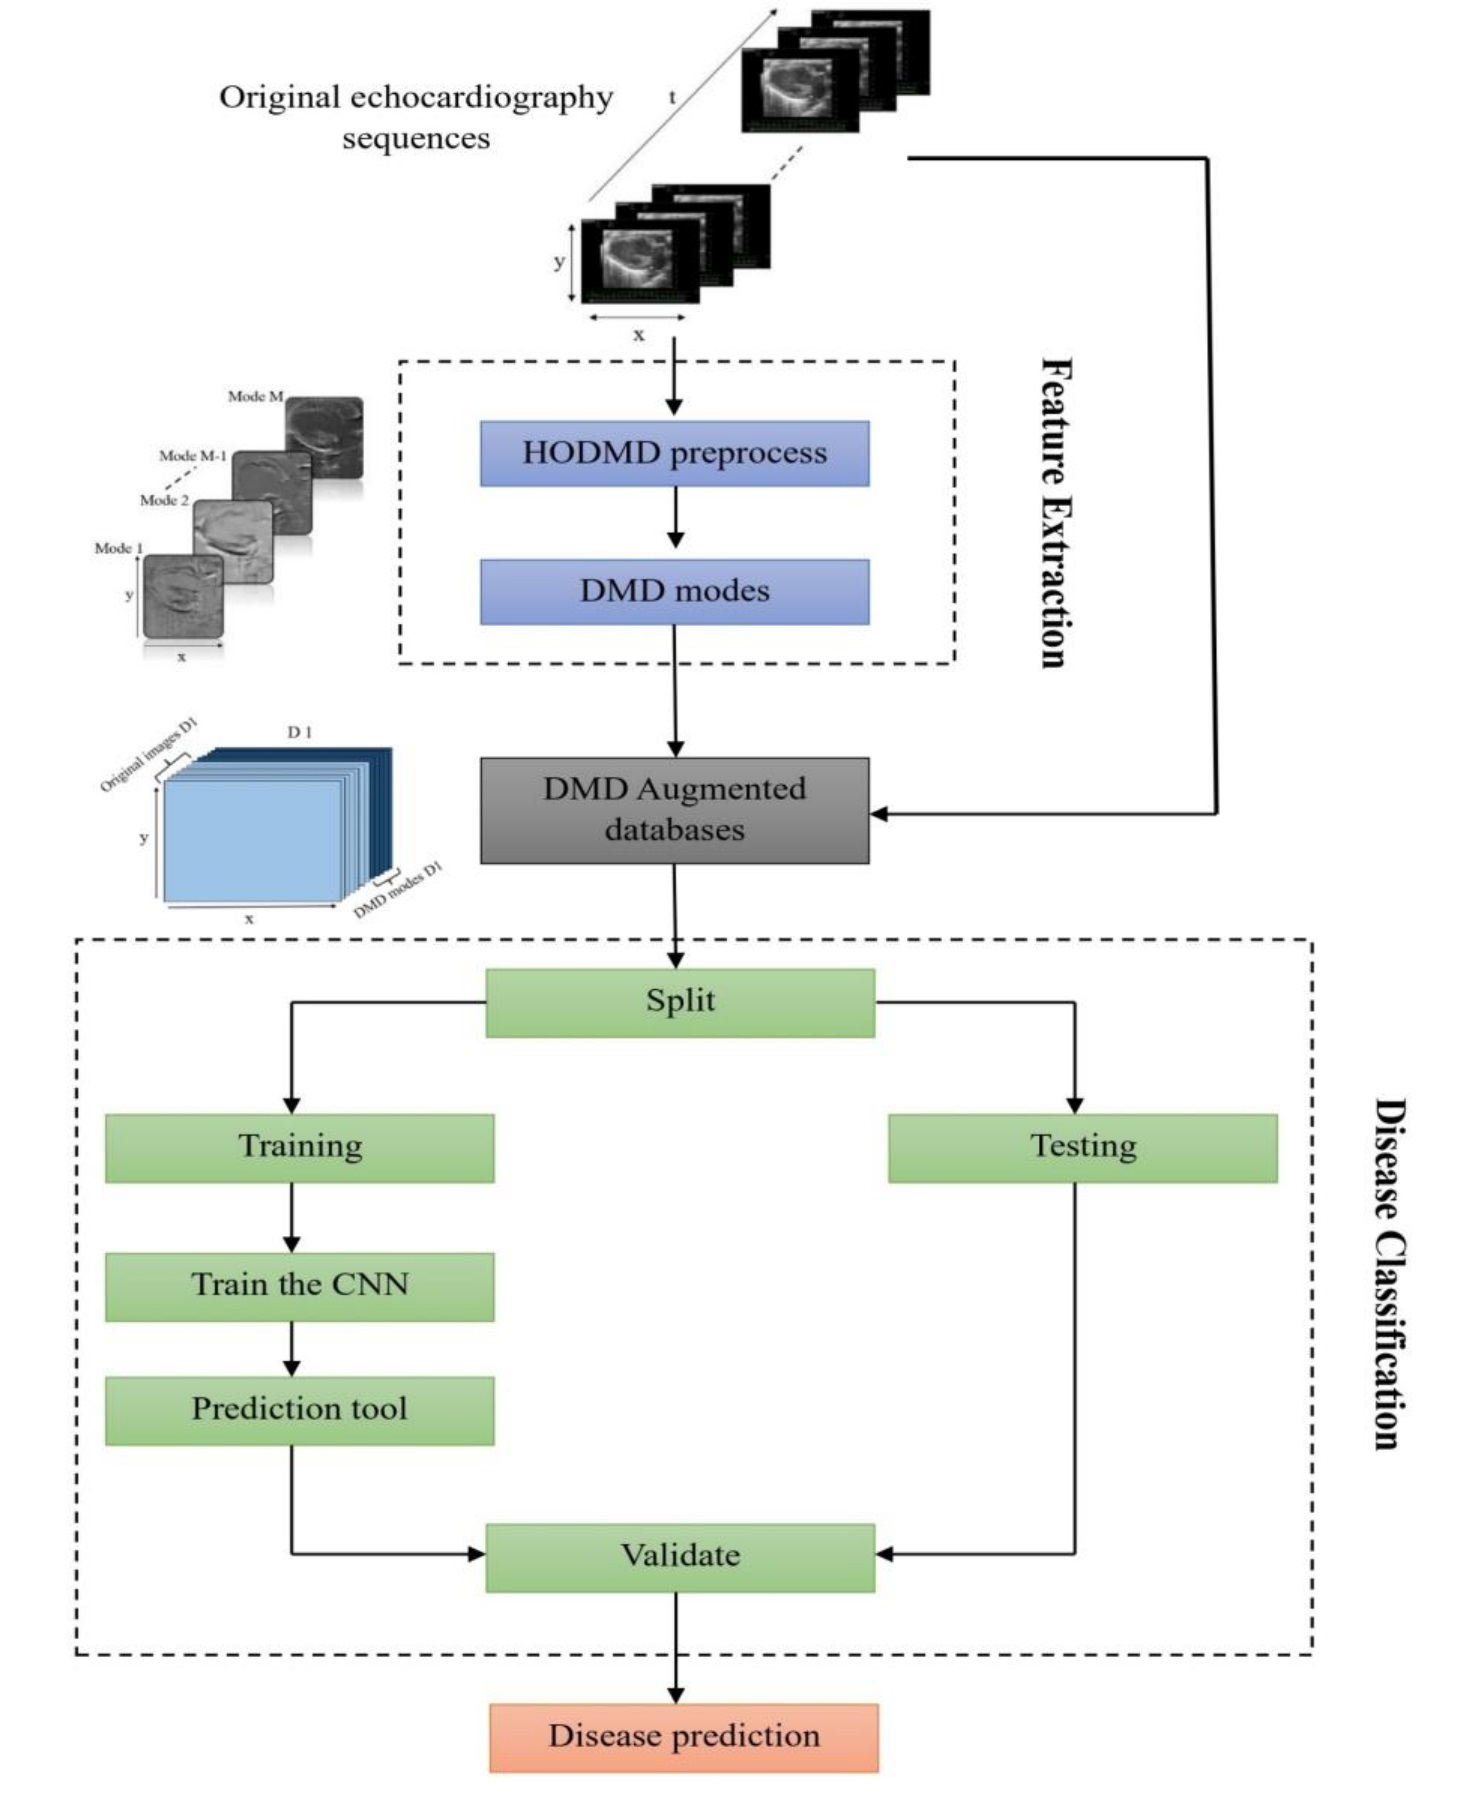
The results obtained from all testcases, and experiments showed a clear improvement in the performance when augmenting the original images using the DMD modes, as it increased the prediction accuracy by 4% - 22%. These results have proved the efficiency of the proposed hybrid tool, which merges model decomposition tools and machine learning approaches, and its ability to enhance classification models and improve predictions on new unseen data.
This work has been used to produce a journal paper, which has been subbmited and currently under review in the journal of Artificial Intelligence In Medicine.
HODMD-based reduced order model for cardiac MRI analysis
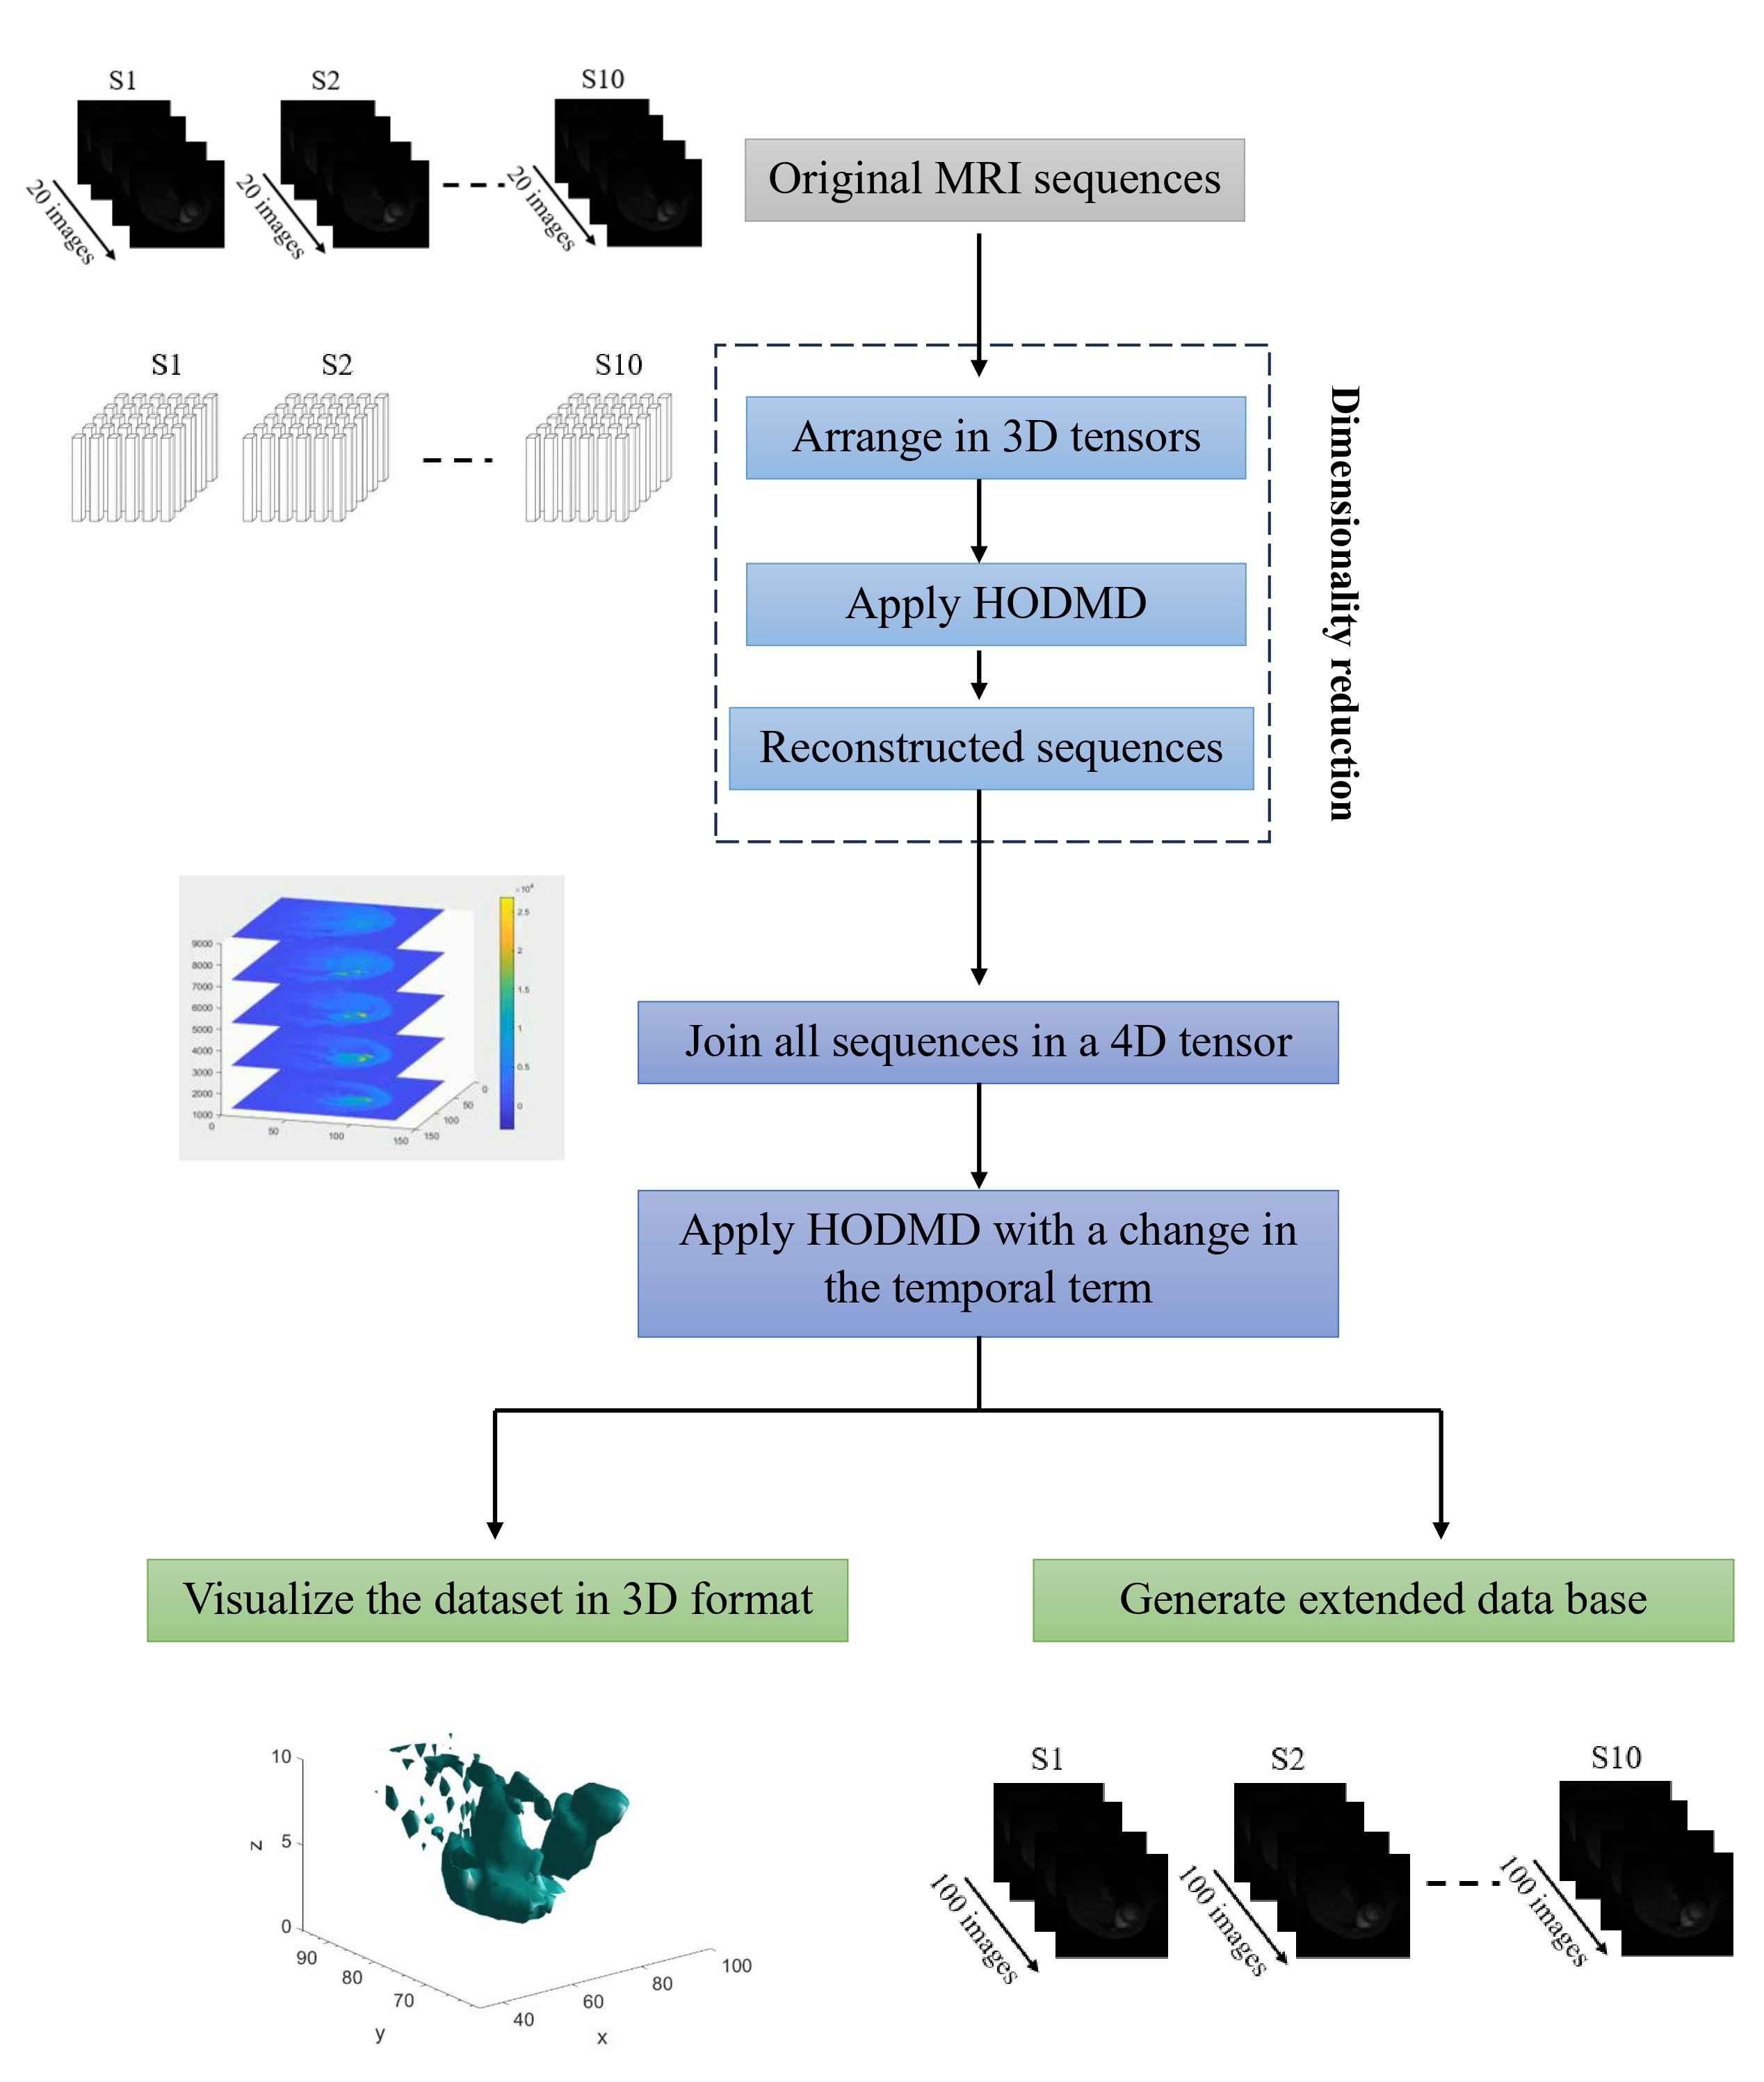
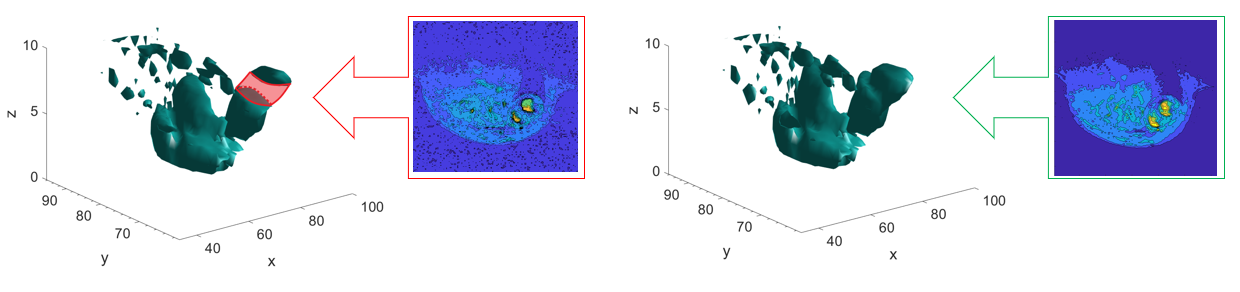
In this application, the HODMD algorithm is used as a reduced order model (ROM) to generate new MRI databases covering more cardiac cycles, varying for longer periods of time. In particular, the HODMD algorithm is applied to the MRI database with a change in the temporal term of the HODMD expansion. As a consequence, the new database generated will consist of 100 snapshots for each slice instead of 20 snapshots. In this way, we will be able to represent the heart, with additional reconstructed snapshots covering more than one cardiac cycle. Additionally, applying the HODMD algorithm to the tensor containing all the MRI sequences permits the use of the HODMD extrapolation properties to fill in any gaps between the individual slices. As a consequence, a 3D visualization of the full heart can be carried out.
SVD Based interpolation tool for information recovery
This new method is applied to the tensor containing all the reconstructed slices in order to recover the information of one missing slice. In particular, the 7th slice has been completely removed, and the two neighboring slices (slice 06 and slice 08) are used to reconstruct all the information of the missing slice. This approach employs the SVD to provide matrix decomposition, while Spline interpolation is used to recover the information of the missing MR images by interpolating through the points of the matrix of the right singular vectors.
A comparison between the snapshot of the original 7th and the same snapshot from the new interpolated slice is shown in the following figure. As seen the images present a qualitative similar shapes and intensities. The noise is the main difference found between the two slices; hence the reconstructed images are clean.
These results have already been published in:
You can also see the explanation of this paper in the following video:
Vision Transformers
This framework implements an automatic cardiac pathology recognition system which analyses in real-time echocardiography video sequences. This works in two stages. The first one creates a large collection of annotated images from different sources of echocardiography videos. This allows to train any machine learning-based frameworks, especially deep learning-based ones. This stage involves the use of modal decomposition techniques, namely, the Singular Value Decomposition (SVD) and the HODMD algorithms, for the first time to the authors’ knowledge, for both data augmentation and feature extraction in the medical field, in a similar way as explained in the Pattern Detection block. The second stage is aimed to build and train a Vision Transformer (ViT), barely explored in the related literature about heart disease recognition in echocardiography images using deep learning. The ViT is adapted for an effective training from scratch, even with scarce databases, usual in the medical field. This designed neural network analyses the images from an echocardiography video to predict the heart state. In this section, the diagnosis or classification task is covered, that is, the classification between different cardiac conditions.

The results obtained show the efficacy of the HODMD algorithm and the superiority of the proposed system, even outperforming pretrained Convolutional Neural Networks (CNNs), the method of choice in the literature.
Further details about the work explained in this section could be found in the following reference:
Download the code for Diagnosis in Python version here. The pretrained weights can be downloaded here.
Prediction
Masked Autoencoders
This section considers the application of the system described above for the prognosis task, which is a challenging and more specific regression task, not previously addressed in the related literature, to the best of the authors’ knowledge, consisting in predicting the time in which a heart failure will happen. In a similar way, the system first creates a large database of annotated images from different sources of echocardiography videos. For this purpose, the use of the SVD and the HODMD algorithms for both feature extraction and data augmentation is involved. After this machine learning-compatible database creation, a ViT is built and trained based on the Masked Autoencoder scheme, in which the pretraining and finetuning stages are performed at the same time, i.e., combining Self-supervised learning (SSL) methods and the Supervised Learning, to deal with scarce databases of echocardiograms. This designed ViT analyses images from an echocardiography video sequence to predict the time in which a heart failure will happen.

The experiments performed demonstrate the efficacy of the modal decomposition algorithms for data augmentation and feature extraction, and also the superiority of the proposed system, obtaining more accurate heart failure times than those with Convolutional Neural Networks (CNN) and Vision Transformers (ViT).
Further details about the work explained in this section could be found in the following reference:
Download the code for Prognosis in Python version here. The pretrained weights can be downloaded here. A fine-tuned version can be found at Hugging Face here.
Diagnosis and prognosis
Masked Autoencoders
CardioMOD-Net, an AI-based tool capable of addressing the two challenging aforementioned tasks, diagnosis and prognosis, is presented in this section. Specifically, CardioMOD-Net can recognize different heart states and estimate the precise time in which a heart failure will happen, becoming the first unified frmework which jointly addresses the challenges derived from each task. For this purpose, CardioMOD-Net combines Modal Decomposition techniques and state-of-the-art Deep Learning algorithms adapted to databases of video sequences of echocardiography images. In particular, the SVD and the HODMD algorithms are employed to each video sequence of echocardiography images for feature extraction and data augmentation, obtaining reconstructions and modes. After that, the AI-based tool based on Masked Autoencoders (MAE) is trained using all those data and combining Self-supervised learning (SSL) methods and Supervised Learning, to deal with scarce databases of echocardiograms. Finally, unseen video sequences of echocardiography images are preprocessed and analyzed with the Modal Decomposition techniques and the trained AI-based tool to perform diagnosis and prognosis.
The results obtained show the potential of this unified framework to integrate diagnosis and prognosis in a single architecture. This offers more information about the heart state evolution of a patient, more effectively preventing from heart failures and improving customized medicine.

The figure depicts an overview of the developed tool for heart disease recognition, capable of addressing two challenging tasks: diagnosis, as heart state classification, and prognosis, as the estimation of the time of a heart failure. (a) The training process of the developed tool, involving a database of echocardiography videos represented as DICOM files with annotations of the heart states and heart failure times. Before training, data augmentation and feature extraction are applied in four steps: (1) Video sequence preprocessing, (2) Singular Value Decomposition (SVD), (3) Higher Order Dynamic Mode Decomposition (HODMD) applied on the reconstructions obtained with the SVD, and (4) SVD applied on the obtained HODMD modes. (b) Diagnosis and prognosis performed using the tool, based on Artificial Intelligence (AI), after being trained, on new video sequences of echocardiography images. Similarly, preprocessing and modal decomposition techniques are applied before the inference.
Further details about the work explained in this section could be found in the following reference:
Code for Diagnosis and Prognosis in Python in progress… Pretrained weights in progress…
CFD Data
The growing impact of cardiovascular disease (CVD) requires advances in diagnosis and treatment. Recent developments in medical research have introduced innovative methods for understanding and treating complex diseases such as CVDs. Among these, Computational Fluid Dynamics (CFD) has emerged as a key tool for modeling the intricate dynamics of intracardiac blood flow. This approach not only enhances our fundamental understanding of cardiac function, but also paves the way for innovative treatment strategies.
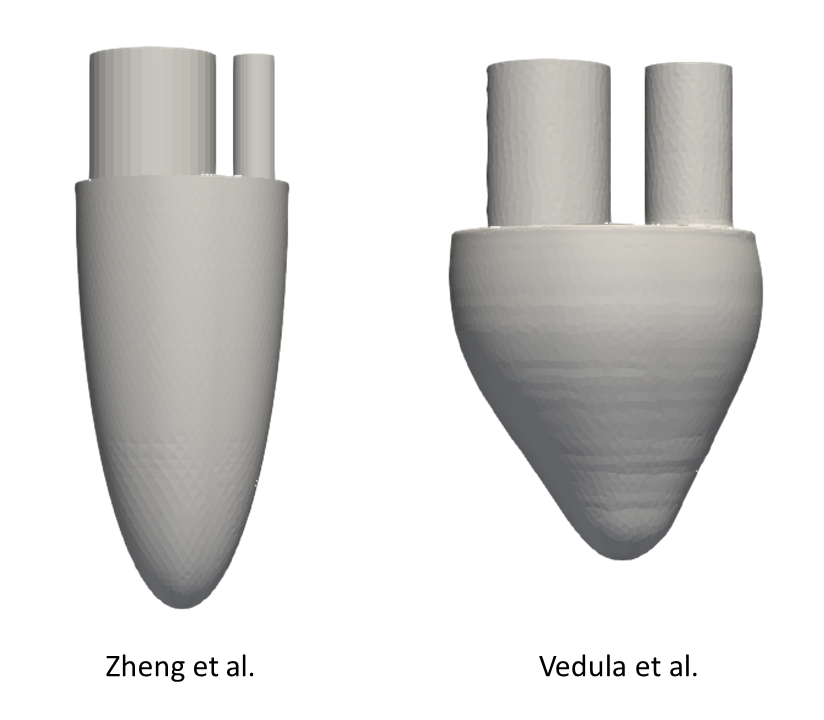
For validation purposes, we base our study on the work of Zheng et al. and Vedula et al:
You can also see the explanation of this project in the following video:
Tutorials
Explore our step-by-step video tutorials on setting up CFD simulations of the left ventricle. These resources include all necessary files to replicate our results, offering a comprehensive guide for anyone aiming to deepen their understanding or reproduce our findings.
Geometry Pre-Processing
This section provides our MATLAB codes for generating STL file sequences that define ventricular wall motion for CFD simulations. The workflow is based on integrating ventricular volume variation from a flow rate chart that describes the quantity of blood coming in and out of the left ventricle.
We offer two approaches:
- Idealized Geometry: Where the wall motion is defined analytically, and STL files are generated accordingly.
- Patient-Specific Geometry: Requires code adjustments since analytical expressions are unavailable. This process includes extracting the left ventricle model from cardiotomography data to ensure accurate patient-specific simulations.
Download the necessary files here.
Download the slides here.
CFD with Star-CCM+
This section provides a complete guide on replicating our blood flow simulations inside the left ventricle using STAR-CCM+. From loading the geometry and meshing to configuring the simulation settings, we walk you through each step to ensure accurate reproduction of our results.
Download the necessary files here.
Download the slides here.
CFD with Ansys Fluent
In this section, we outline the entire process of setting up blood flow simulations within the left ventricle using Ansys Fluent. From importing the geometry and generating the mesh to configuring the simulation parameters, this guide covers everything needed to successfully replicate our results.
Download the necessary files here.
Download the slides here.
You can obtain the necessary tools and softwares here:
Results
The ideal models of the left ventricle (LV) for our simulations are taken directly from these references and are shown in the following figure. These models essentially represent an idealization of the ventricular cavity with two tubes attached to simulate inflow and outflow through the mitral and aortic valves, respectively.
The computational framework used in this study is designed to solve the Navier-Stokes equations, assuming that blood behaves as an incompressible non-Newtonian fluid. We choose laminar flow conditions that are particularly effective in capturing the vortical features of the diastolic phase of the cardiac cycle. Boundary conditions are a critical aspect; therefore, wall motion, inflow and outflow are set to match the ventricular flow rate curve extracted from references. A grid convergence study was performed to ensure that the simulations were fine-tuned.
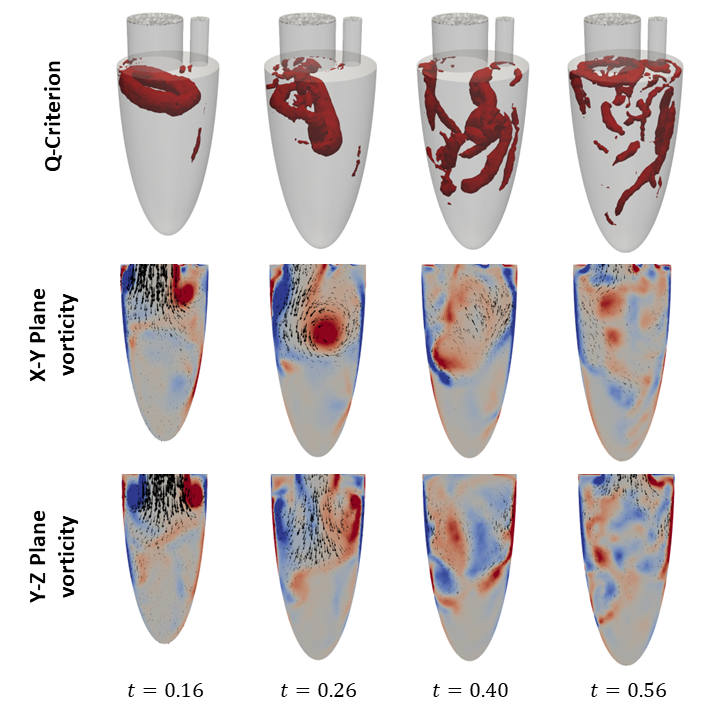
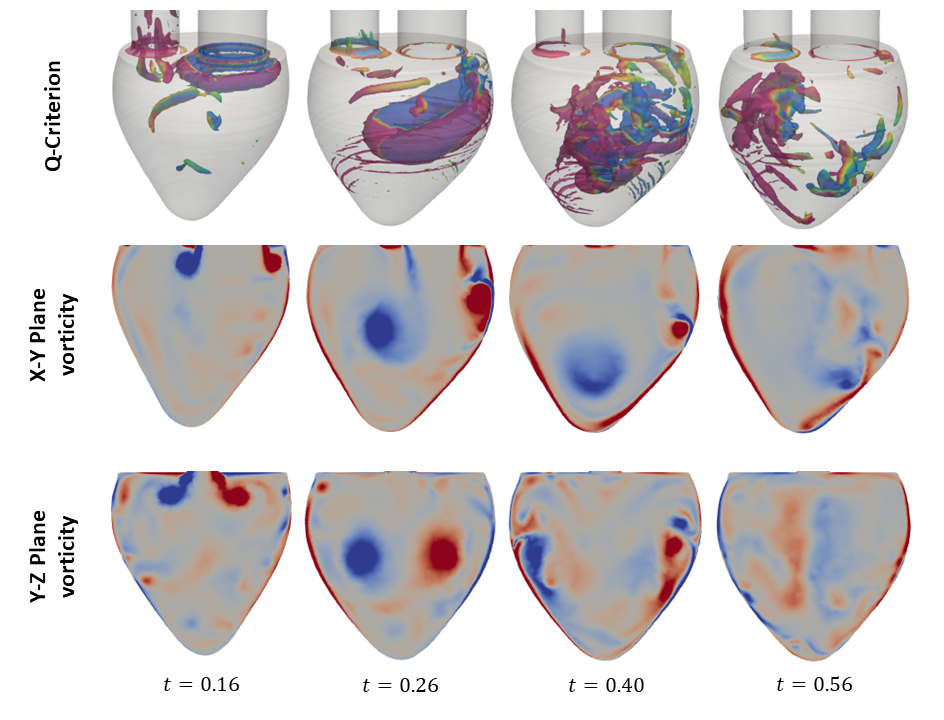
The primary objective of this study is to examine the formation and evolution of the vortex ring, a prominent flow feature during the E-wave of diastole. The vortex ring plays a pivotal role in cardiac hemodynamics and has been extensively studied in the literature. The vortex ring emerges from the mitral valve during the E-wave of diastole, with its axis aligned with the mitral valve axis. The initial shape of the vortex ring is that of a donut, although it is asymmetric, with a thinner profile closer to the wall. This indicates a healthy heart. As the vortex ring traverses the ventricle, it gradually tilts due to the reduction in inflow velocity. Interactions between the vortex ring and the ventricular walls result in the formation of secondary vortex tubes. These vortex tubes exhibit complex instabilities, which ultimately result in their interaction with the vortex ring and its subsequent destabilization. The evolution of this flow structure is depicted in Figures X and Y for the geometries used by Zheng et al. and Vedula et al., respectively.
This analysis highlights the importance of CFD in advancing our understanding of intracardiac flow dynamics and developing improved diagnostic and therapeutic strategies for cardiovascular diseases.
Pattern detection
This section considers the combination of Proper Orthogonal Decomposition (POD) and Autoencoder (AE) architectures for early detection of cardiac deterioration. In this process, representative flow features characterizing different cardiovascular conditions are extracted from left ventricular flow fields obtained from fluid dynamics simulations. These features are contained in nearly orthogonal POD modes produced by the Autoencoders which capture a specified percentage of kinetic energy.

For small encoding dimensions, POD and Variational Autoencoders (VAE) can generate modes accurately representing the physics and flow features and latent variables corresponding to independent spatial structures and different frequency content. Moreover, VAEs are less sensible to the latent dimension and better preserve orthogonality between modes with respect to other AE architectures.
Overall, AEs have the potential to reproduce POD-like coherent structures and to extract physically meaningful representations of cardiac flow dynamics, useful for several challenging clinical applications and contributing to clinical decision-making.
Further details about the work explained in this section could be found in the following reference: